Shipped: admin dashboard for node operators
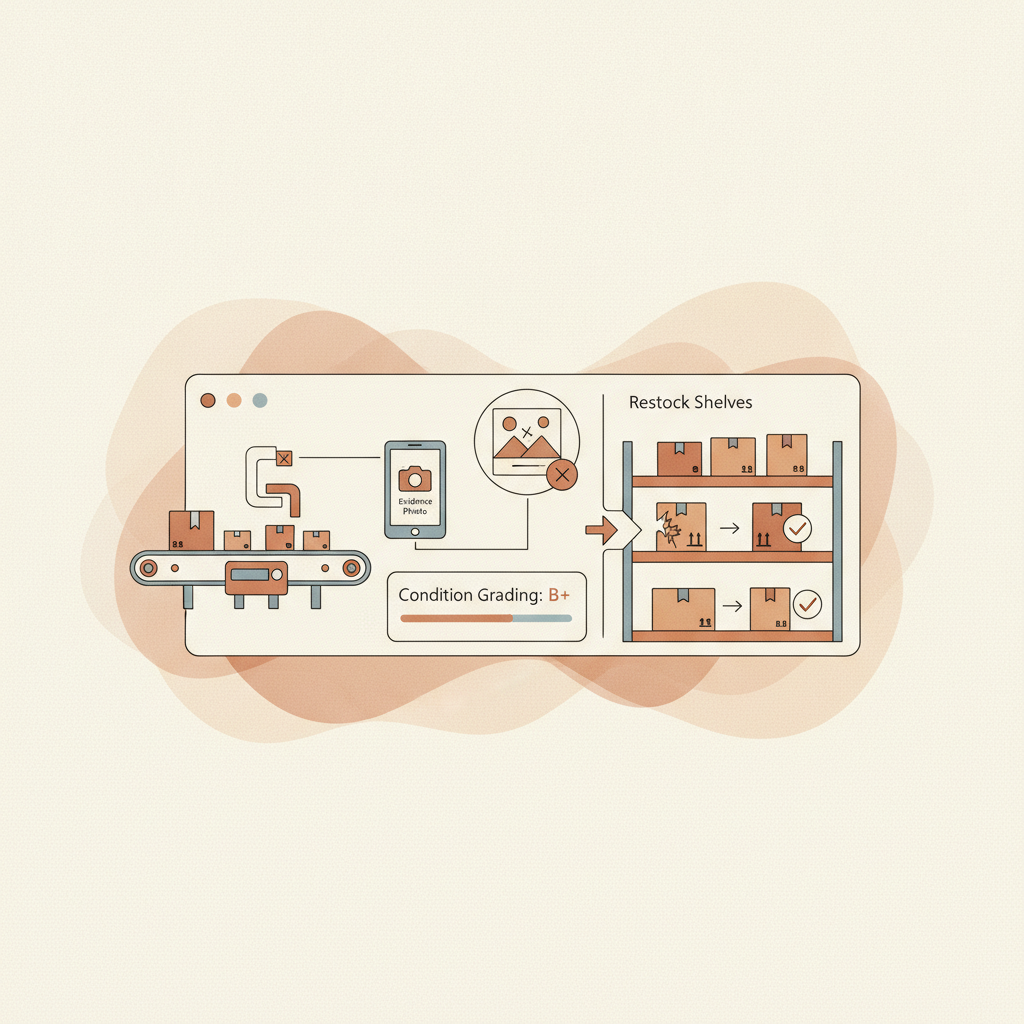
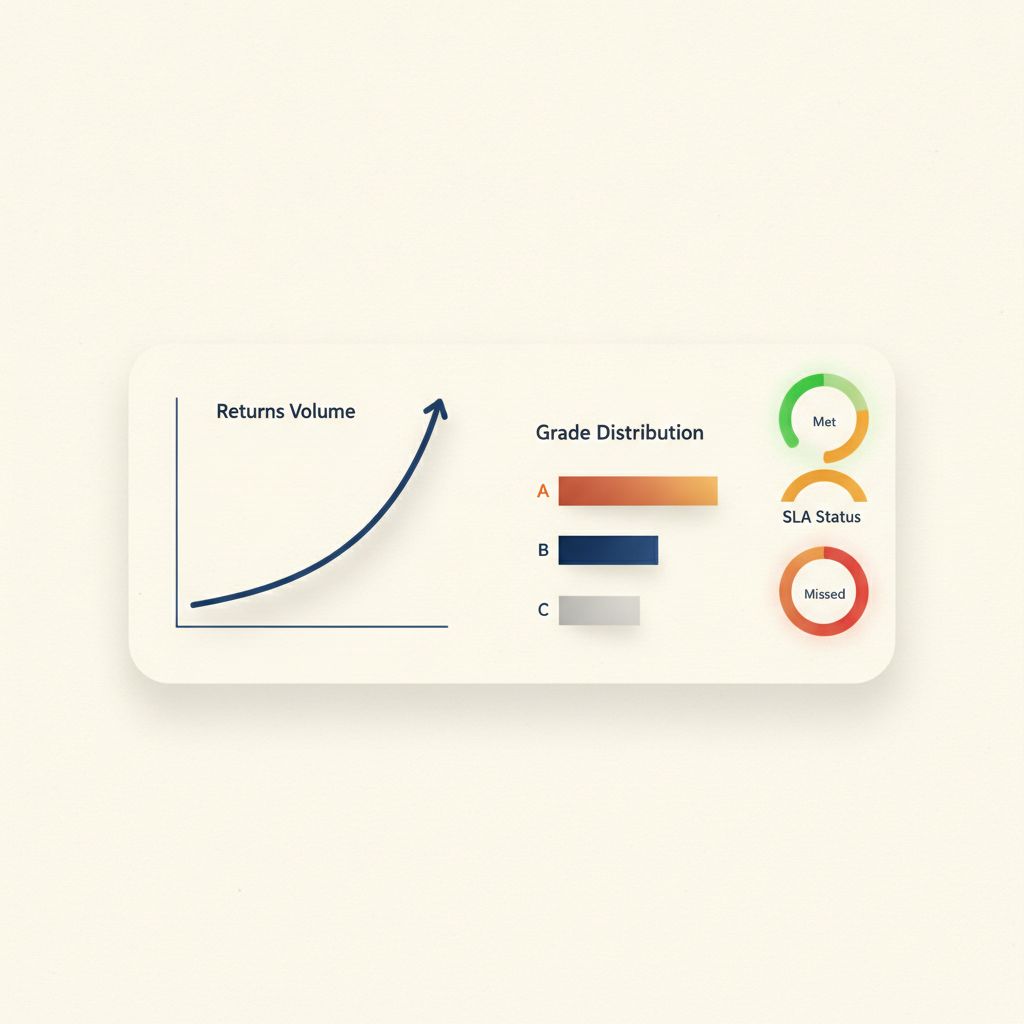
An admin dashboard for returns node operators is a single operational view inside areturnz that shows a node operator everything happening across their tenants: inbound volume, grading mix, disposition outcomes, and SLA status, updated against the network's actual processing data rather than a static report. areturnz shipped this dashboard to give operators a working console for the returns they run day to day, built on top of the same evidence and grading pipeline that handles every one of the 180K+ returns processed on the network to date.
What shipped
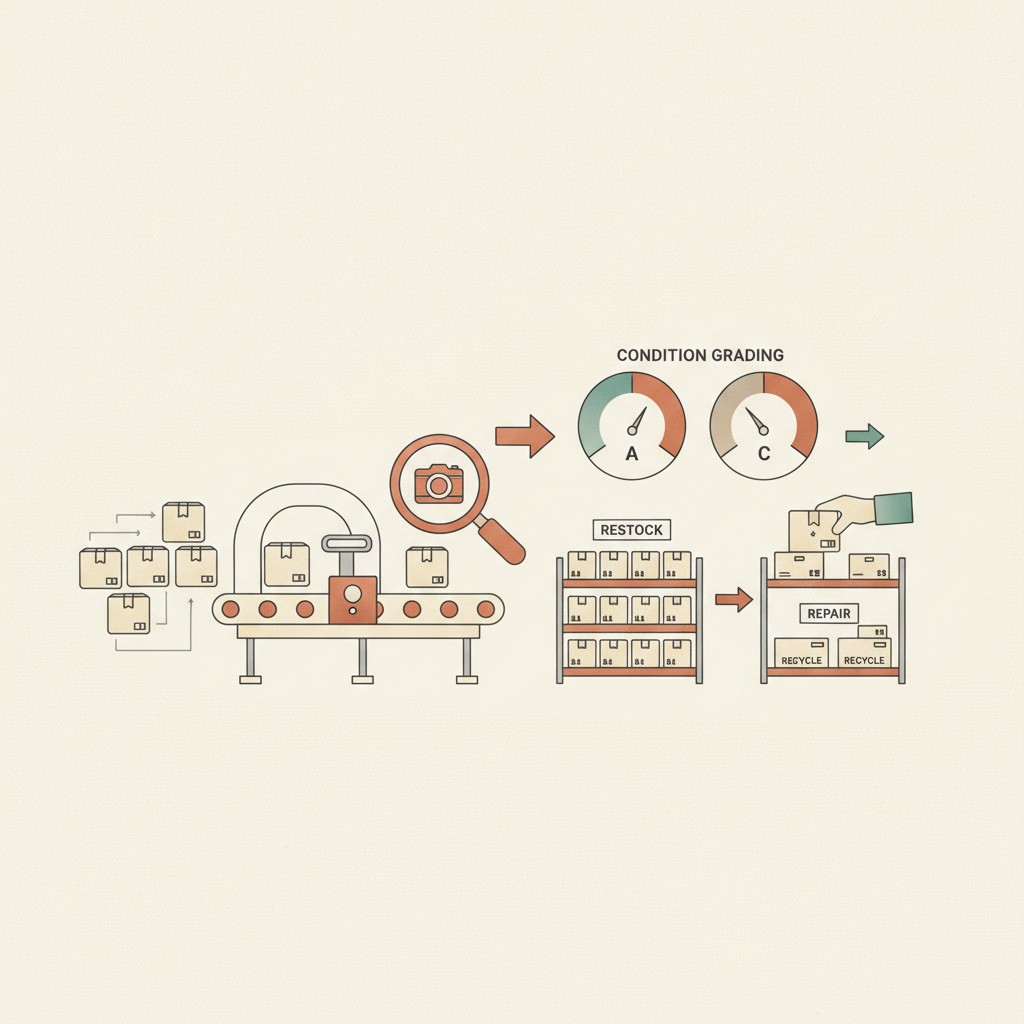
The release adds an operator-facing admin view that sits above the existing receiving and grading tools. Instead of pulling data from exports or waiting on a report cycle, a node operator now opens one screen and sees current throughput, grade distribution across A, B, C, and R, and where parcels sit against the roughly 48 hour median cycle from inbound scan to disposition. It is built for people running the floor, not just the people reading about it afterward.
This sits alongside the per-tenant reporting work covered in per-tenant reporting for returns partners, but the admin dashboard is narrower on purpose: it is the operational cockpit, while per-tenant reporting is the output partners and brands receive.
Why node operators needed this
Running a node means juggling more than one tenant's SLA at a time. Before this shipped, an operator had to check receiving counts in one place, grading confidence in another, and disposition overrides in a third. None of that is hard individually, but it adds friction at exactly the moment a node is closest to missing a commitment, usually during a volume spike.
The gap it closes
The dashboard pulls those signals into one place and keeps them scoped to the node operator's own tenants, which matters more than it sounds. A node running returns for three brands should never see another node's queue, and the 99.6% AI-vs-operator match accuracy figure areturnz tracks across the network only holds up if every node's data stays correctly isolated while still being fully visible to the people responsible for it.
What is inside the dashboard
| Panel | What it shows | Why it matters to the operator |
|---|---|---|
| Receiving volume | Parcels scanned in, by hour and by tenant | Flags a surge before it turns into an SLA miss |
| Grade distribution | Live breakdown across A, B, C, and R grades | Shows whether incoming condition mix is shifting for a tenant |
| Confidence and overrides | AI confidence scores and operator override rate | Keeps the 99.6% AI-vs-operator match rate visible, not assumed |
| Disposition status | Restock, liquidate, donate, destroy counts | Tracks where margin recovery is actually landing |
| Cycle time | Time from inbound scan to final disposition | Benchmarks against the 48 hour network median |
How it fits the node operator workflow
A new node operator typically learns the receiving and grading flow first, then grows into managing SLA commitments across tenants. The admin dashboard is meant to be the tool that onboarding leads into, not a separate system to learn later. The node operator onboarding guide walks through the earlier stages of setting up a node; this dashboard is the daily driver once that node is live and taking volume.
It also ties back into the broader direction covered on the product updates hub, where every shipped feature, from receiving tools to evidence capture, gets logged as part of how areturnz keeps the network operable at scale rather than just accurate on paper.
Frequently asked questions
Is the admin dashboard available to every node operator?
Yes, it ships as a standard part of the node operator console and scopes automatically to whichever tenants that operator is responsible for.
Does this change how disposition rules work?
No. Disposition logic, the routing of a return to restock, liquidate, donate, or destroy, stays the same. The dashboard just makes the resulting counts and overrides visible in real time instead of after the fact.
Can a node operator see data from tenants they do not manage?
No. Tenant isolation is enforced the same way it is across the rest of the platform, so the dashboard only surfaces data for the node operator's own assigned tenants.
How does this relate to per-tenant reporting for partners?
The admin dashboard is the operator's working view. Per-tenant reporting is what gets packaged and shared out to partners and brands, built from the same underlying data, described in more detail in the per-tenant reporting post.
Where can I see what evidence looks like for a processed return?
You can review a real example on the evidence sample page, which shows the photo and grading detail behind a single return.
If you operate a node or are evaluating areturnz for a new one, contact the team to see the admin dashboard in a live walkthrough.
Proof on every return
Photos, an AI condition grade, and a full custody chain, attached to every parcel and available via the API.