Returns Economics
The numbers behind reverse logistics: cost, restock velocity, and margin recovery.
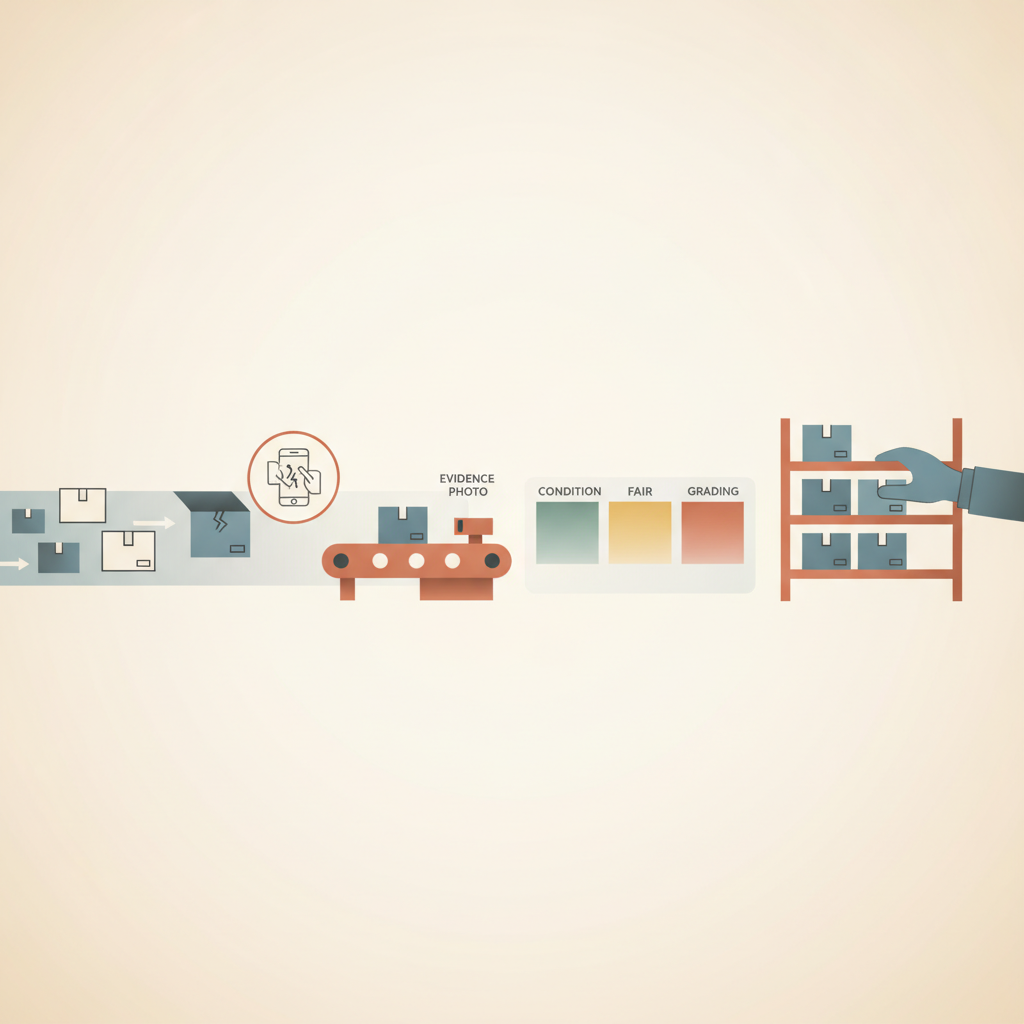
Cost of Returns Processing: The Complete Returns Economics Guide
The cost of returns processing is more than the refund. This is the full breakdown of what drives it, where the money actually leaks, and how a 48 hour cycle and AI grading change the math.

What It Really Costs to Outsource Returns Processing
Outsourcing returns processing costs more than the quoted per-unit fee. Here is what actually shows up on the invoice, and how to judge it against in-house handling.
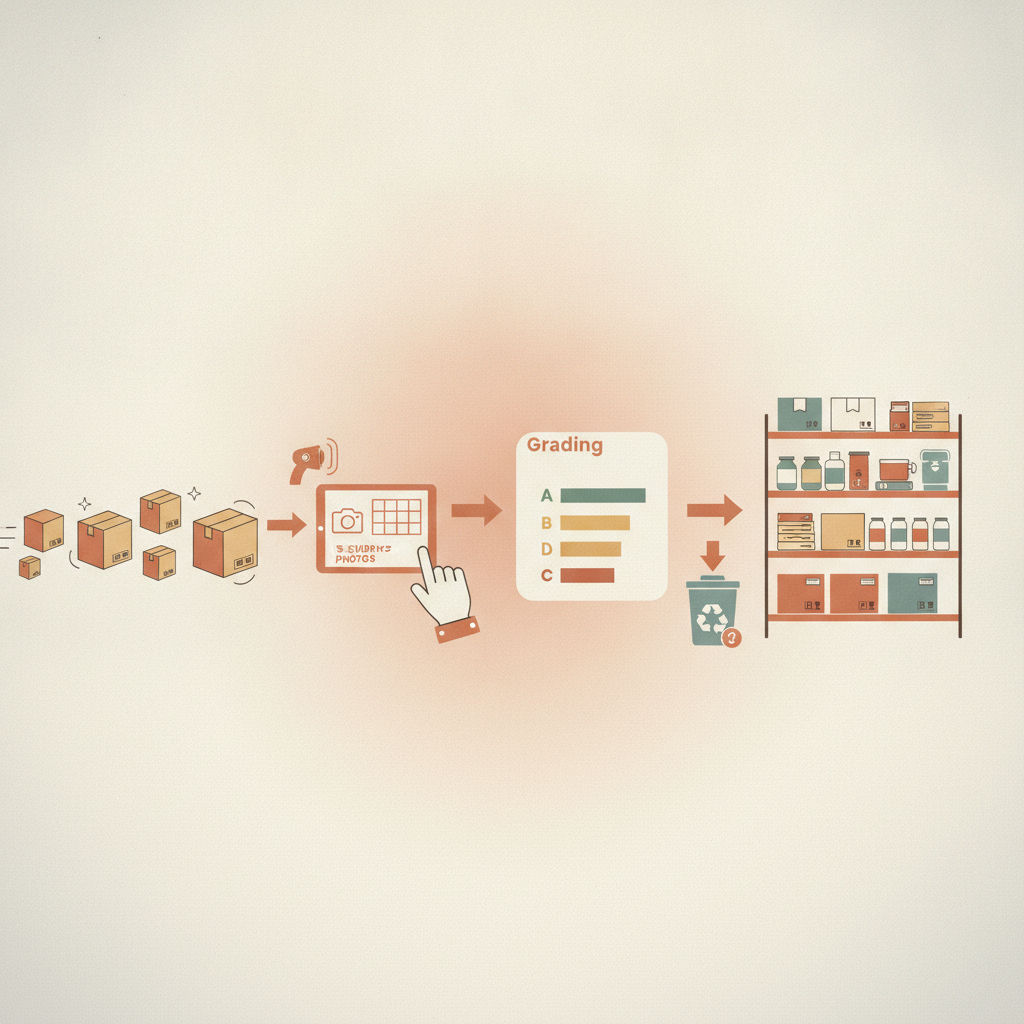
Designing a Holiday Return Window Policy That Does Not Eat Your Margin
Extended holiday return windows drive sales, but every extra week you grant a shopper is a week your inventory sits ungraded. Here is how to design a window that protects both.
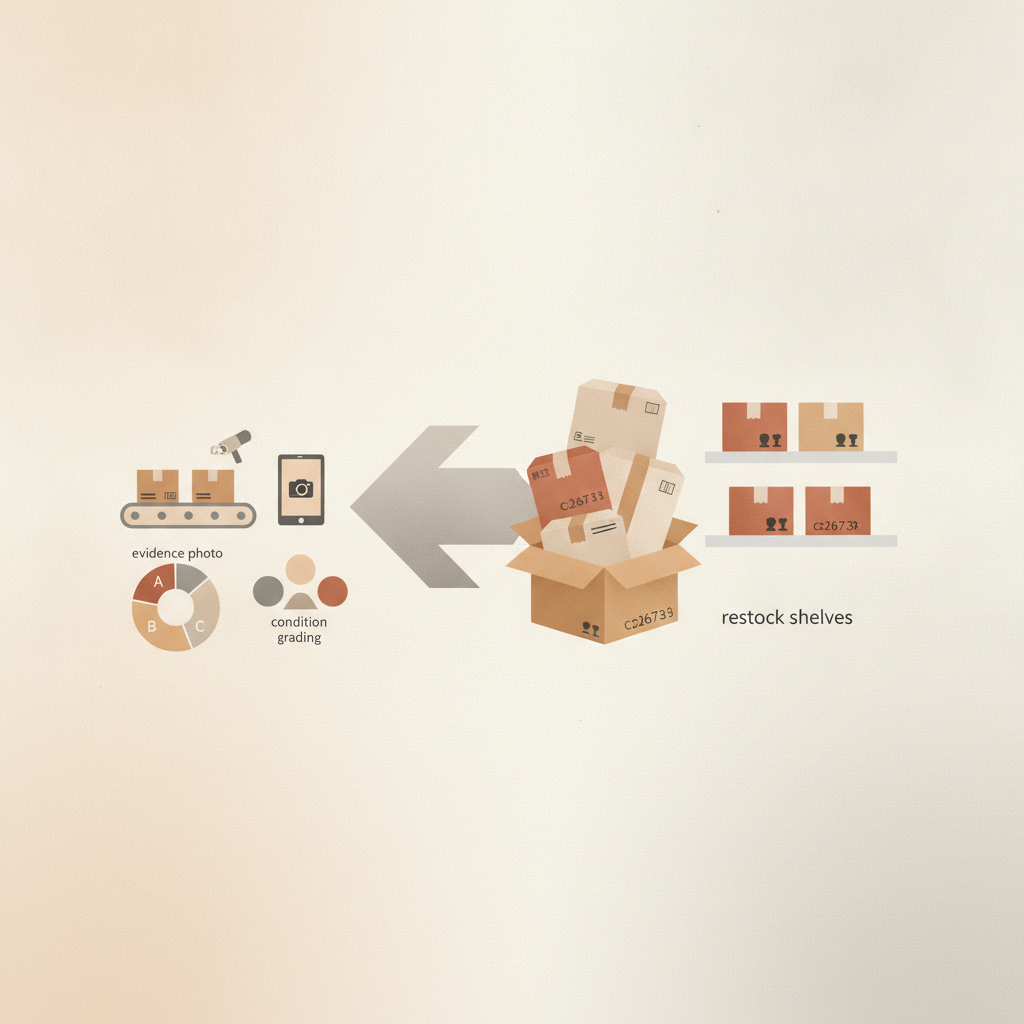
The January Returns Spike: What Changes After the Holidays End
Holiday shopping ends but the returns keep coming for weeks. Here is what actually changes in the data, the grading mix, and the disposition math once January hits, and how a network built for speed handles the surge.

Peak season returns planning: budgeting for Q4 volume before it hits
Q4 returns volume does not spread out evenly, it slams into the last two weeks of December and the first three weeks of January. Here is how to budget for it before it hits.

Returns reserve accounting: budgeting for the returns you have not received yet
A returns reserve built on refund rate alone almost always undercounts what a business owes itself. Here is how to model the liability properly, using grading and disposition data instead of guesswork.

Liquidation recovery rates: what you actually get back
Liquidation recovery rates swing from 5 cents to 60 cents on the dollar depending on grade, category, and channel. Here is what actually drives the number and how disciplined grading protects it.

The real cost of a chargeback for returns-heavy sellers
A chargeback is never just the disputed amount. Between fees, lost inventory, and reserve holds, returns-heavy sellers often pay three to five times the transaction value. Here is where that cost hides and how evidence closes the gap.

Markdown Decay vs Restock Speed: The Clock That Erodes Margin
Every day a returned item sits ungraded, it loses resale value. This is the math behind markdown decay, why restock speed is the only real countermeasure, and how a 48 hour median cycle changes the equation.

Returns as a P&L Line: Accounting for the Hidden Cost Center
Most finance teams bury returns inside COGS and call it done. That hides the real damage. Here is how to pull returns out as their own P&L line, with the buckets, the math, and the recovery numbers to check it against.

Cross-border returns: the math that changes at the EU border
Shipping EU returns back to a US facility eats the resale value. Local intake changes the economics of every cross-border return.

Restock velocity: the metric that pays for your returns program
If a returned item is resellable, every day it is not back on the shelf is lost margin. Restock velocity is the number that turns returns from a cost center into recovered revenue.

The real cost of a return is not the refund
The refund is the visible number. The hidden cost is the days an item sits ungraded and unsellable. Here is how to measure what a return actually costs you.