The January Returns Spike: What Changes After the Holidays End
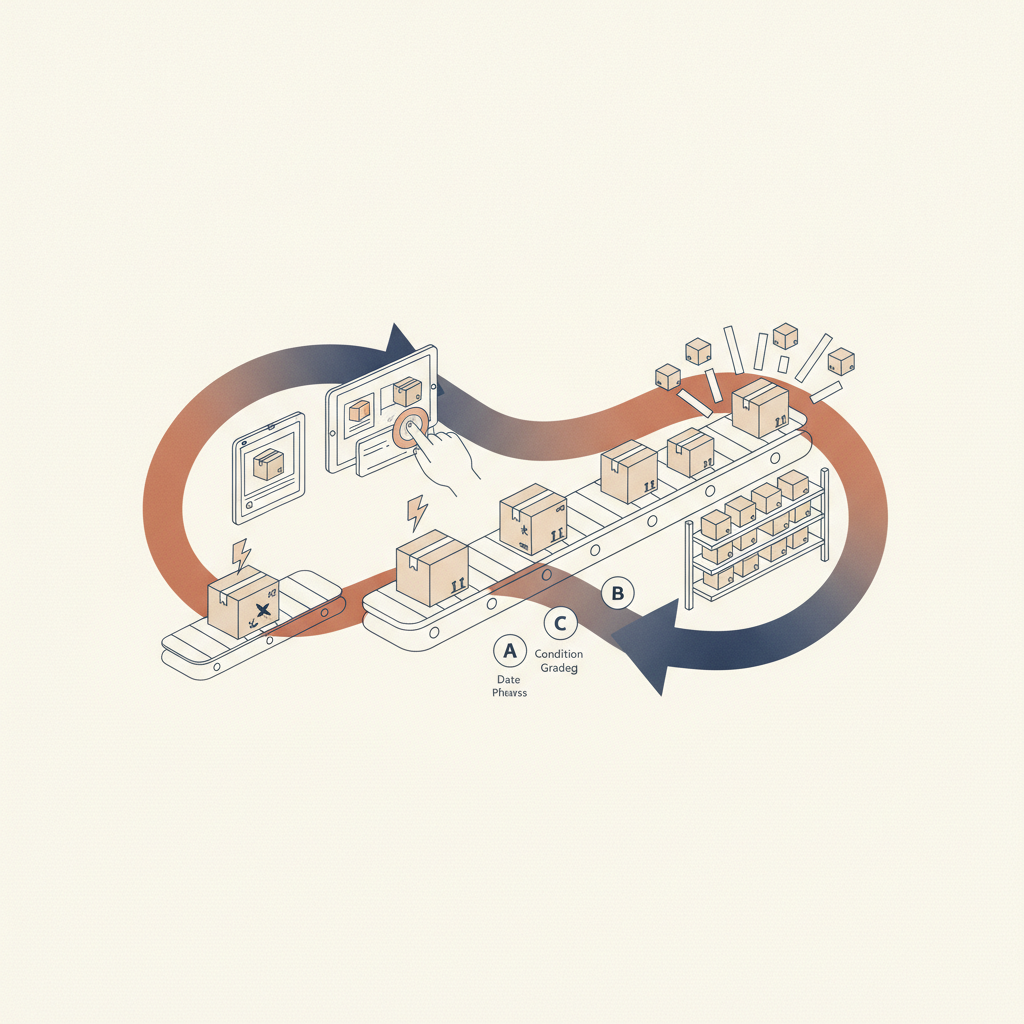
The january returns spike is the surge of returned merchandise that arrives from late December through early February, driven by gift returns, holiday overbuying, and post-season size and fit exchanges. It behaves differently than a normal week of returns: higher volume, a different mix of reason codes, and a shorter window before markdown decay eats the margin. areturnz processes this surge the same way it processes every parcel year round, with a photographed receiving step, AI condition grading on the A/B/C/R scale, and disposition routing that runs on an about 48 hour median cycle from inbound scan to decision.
Why the calendar breaks in mid-December
Most retailers plan capacity around Black Friday and Cyber Monday. That is the wrong peak to plan for. The order peak happens in November. The returns peak happens six to ten weeks later, once gifts are opened, sizes are tried, and post-holiday credit card statements arrive. By the time January returns hit a warehouse, the holiday operations team that handled the order surge has often been reassigned, temp labor has rolled off, and the receiving dock is running on a skeleton crew right when volume is climbing, not falling.
This mismatch is the core problem behind the january returns spike. It is not really a volume problem, it is a staffing and timing problem layered on top of a volume problem.
What actually changes once the holidays end
Volume arrives in a compressed window
Instead of a steady trickle, returns show up in a wave that can run three to four times normal daily intake for several weeks. Facilities that size receiving capacity for an average week get buried in week one and are still catching up in week four.
The grade mix shifts toward A and B
Gift returns tend to be unopened or lightly handled. That pushes more units toward A and B grades than a typical return batch, which is actually good news for resale value, provided the grading and disposition pipeline can keep pace. A slow pipeline turns A-grade inventory into stale inventory, and stale inventory sells for less no matter how clean it looked on day one.
Reason codes tilt toward "unwanted gift" and "wrong size"
Damage and defect rates usually drop as a share of total returns during this window, while fit and preference reasons climb. That matters for disposition rules, since a wrong-size return with intact packaging routes very differently than a defective unit, and getting that routing wrong at scale either strands sellable inventory in liquidation or sends damaged goods back into restock.
Markdown decay accelerates
January is also clearance season. Apparel and seasonal goods lose shelf value fast once the calendar turns, so the clock between receiving a return and getting it back on a shelf or into a resale channel is tighter than any other time of year. Our related piece on markdown decay versus restock speed covers the mechanics in more depth.

The economics side by side
The table below compares typical characteristics of a normal processing week against the january spike window, based on patterns we see across the network.
| Factor | Typical week | January spike window |
|---|---|---|
| Daily inbound volume | Baseline | 3x to 4x baseline |
| Grade mix (A/B share) | Moderate | Higher, more gift returns are unopened or lightly used |
| Top reason codes | Defect, wrong item, damaged in transit | Unwanted gift, wrong size, changed mind |
| Markdown decay pressure | Standard | Accelerated, clearance season compresses the sell window |
| Staffing availability | Full seasonal crew | Reduced, temp labor often rolled off |
| Time-to-disposition needed | 48 hour median works fine | 48 hour median matters even more, delay compounds fast |
How the surge gets absorbed without slowing the cycle
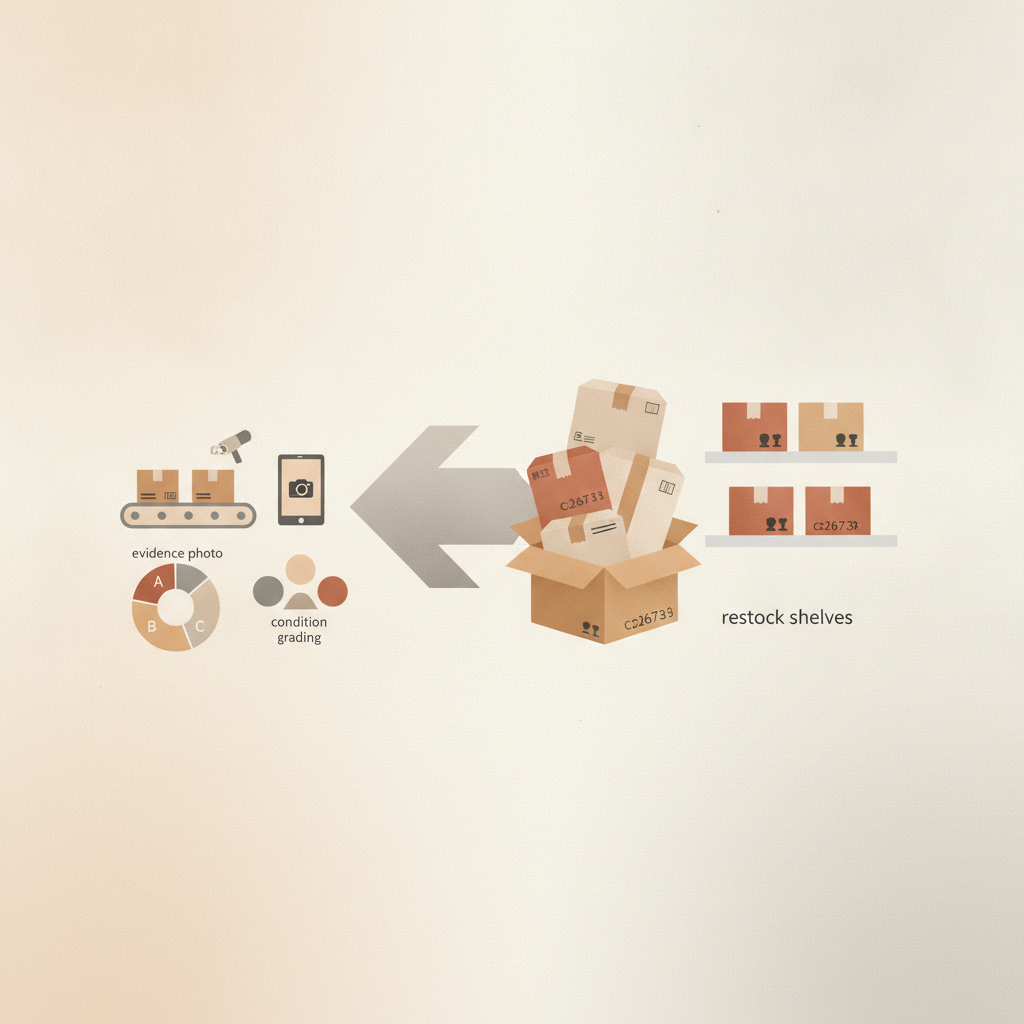
A returns process built for average weeks tends to fail exactly when it is needed most. areturnz runs the same evidence-first workflow year round: every parcel gets photographed at the outer label, at open, and at the item level, AI grades condition on the A/B/C/R scale with a confidence score, and disposition rules route each unit to restock, liquidate, donate, or destroy with any operator override logged. Across more than 180K returns processed, that grading holds a 99.6% AI-versus-operator match rate, which means the surge does not force a tradeoff between speed and accuracy.
The 48 hour median cycle from inbound scan to disposition is the number that matters most in January specifically, because every extra day a gift return sits ungraded is a day closer to a markdown that did not need to happen. Facility NJ-01 in East Hanover, New Jersey runs this same pipeline whether it is a quiet Tuesday in March or the first week of January.
Planning ahead of the next spike
Retailers that treat the january spike as a known, recurring event rather than a surprise tend to do three things: they budget a returns reserve ahead of the holiday selling season (see our guide on returns reserve accounting), they track restock velocity as a real metric rather than an afterthought (covered in restock velocity: the metric that pays for your returns program), and they line up processing capacity that can flex with volume instead of running on fixed headcount. Partners evaluating outsourced capacity for peak windows can review options on the partner use cases page or check current pricing before the surge hits.
For a deeper look at the full economics of returns processing, our returns economics hub ties these seasonal patterns back to the broader cost, margin, and recovery math retailers deal with all year.
Frequently asked questions
When does the january returns spike actually start and end?
It typically begins in the last week of December as gift returns start arriving and runs through late January or early February, though exact timing shifts a bit each year depending on shipping cutoffs and how holidays fall on the calendar.
Why do defect rates drop during the spike?
Gift returns skew toward unwanted or wrong-size items rather than damaged goods, since the person returning the item often never used it. That pushes the overall grade mix toward A and B rather than C or R.
Does a 48 hour cycle actually hold up during 3x to 4x volume?
The median cycle is designed to hold under variable load because grading and disposition are AI-driven with logged operator oversight rather than dependent on adding headcount at the same rate as volume. That is the main reason the cycle stays close to 48 hours even in the surge window.
What is the biggest mistake retailers make planning for January?
Sizing returns capacity around the November order peak instead of the January returns peak. The two events are six to ten weeks apart and require different staffing and processing assumptions.
How does evidence help during a high-volume period like this?
Photo evidence and grading confidence scores matter more, not less, when volume spikes, because disputes and INAD claims tend to rise alongside gift return volume. An evidence bundle on every parcel keeps disputes closable without slowing disposition.
If you want to see how the network handles a real return end to end, including the photo evidence bundle, visit the evidence sample page, or contact us to talk through capacity planning ahead of your next January.
Proof on every return
Photos, an AI condition grade, and a full custody chain, attached to every parcel and available via the API.