Shipped: Operations Ledger and a Transparent Pricing View

The operations ledger and pricing view is a dashboard feature from areturnz that lines up every parcel's timeline of events (received, graded, disposed) next to the exact fee that event generated, so a retailer or partner can see cost and cause on the same screen instead of reconciling two systems. It shipped as part of the ongoing product updates track and answers a question we kept hearing from finance teams: what did this specific return cost us, and why.
Until now, the evidence bundle told you what happened to a parcel (the photos, the grade, the disposition) and a separate invoice told you what you paid. Both were accurate. Neither one, on its own, let a controller trace a line item back to the operational event that caused it. The ledger closes that gap.
What the ledger actually shows
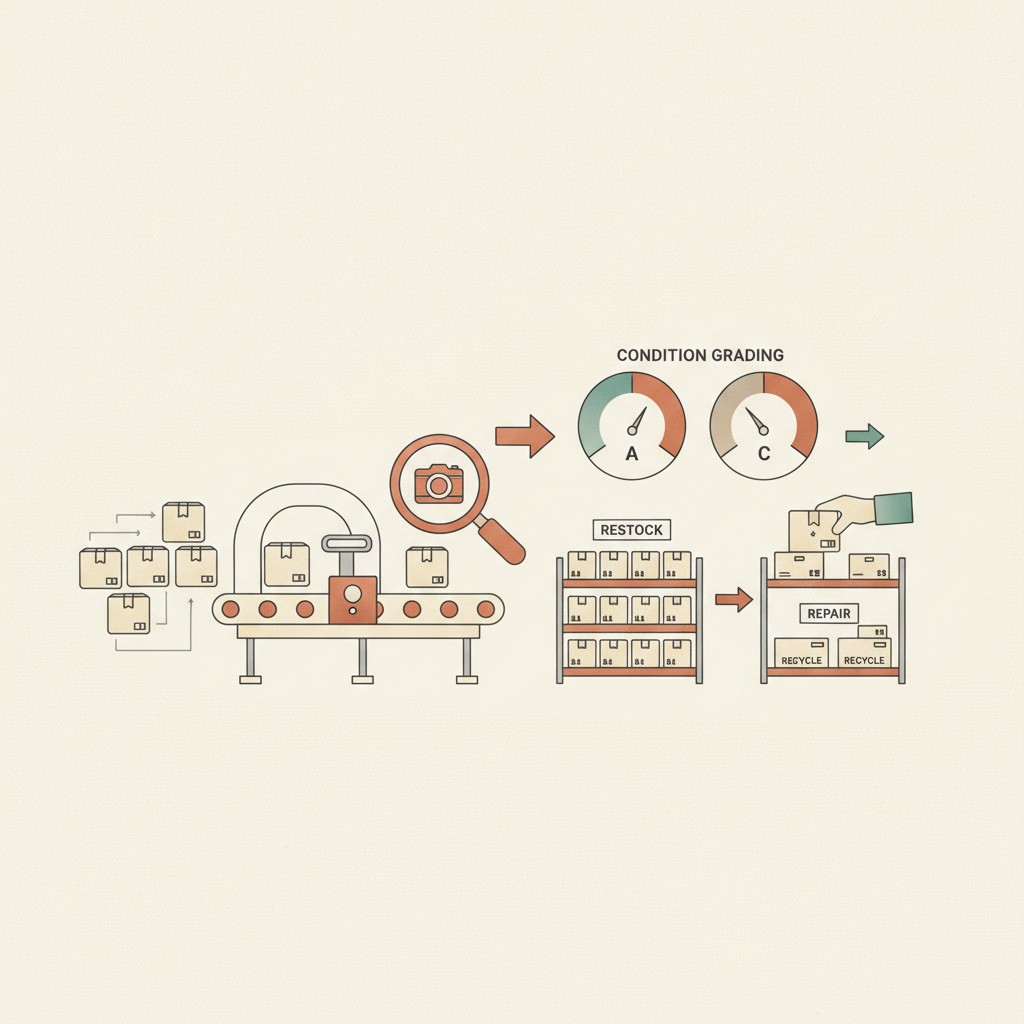
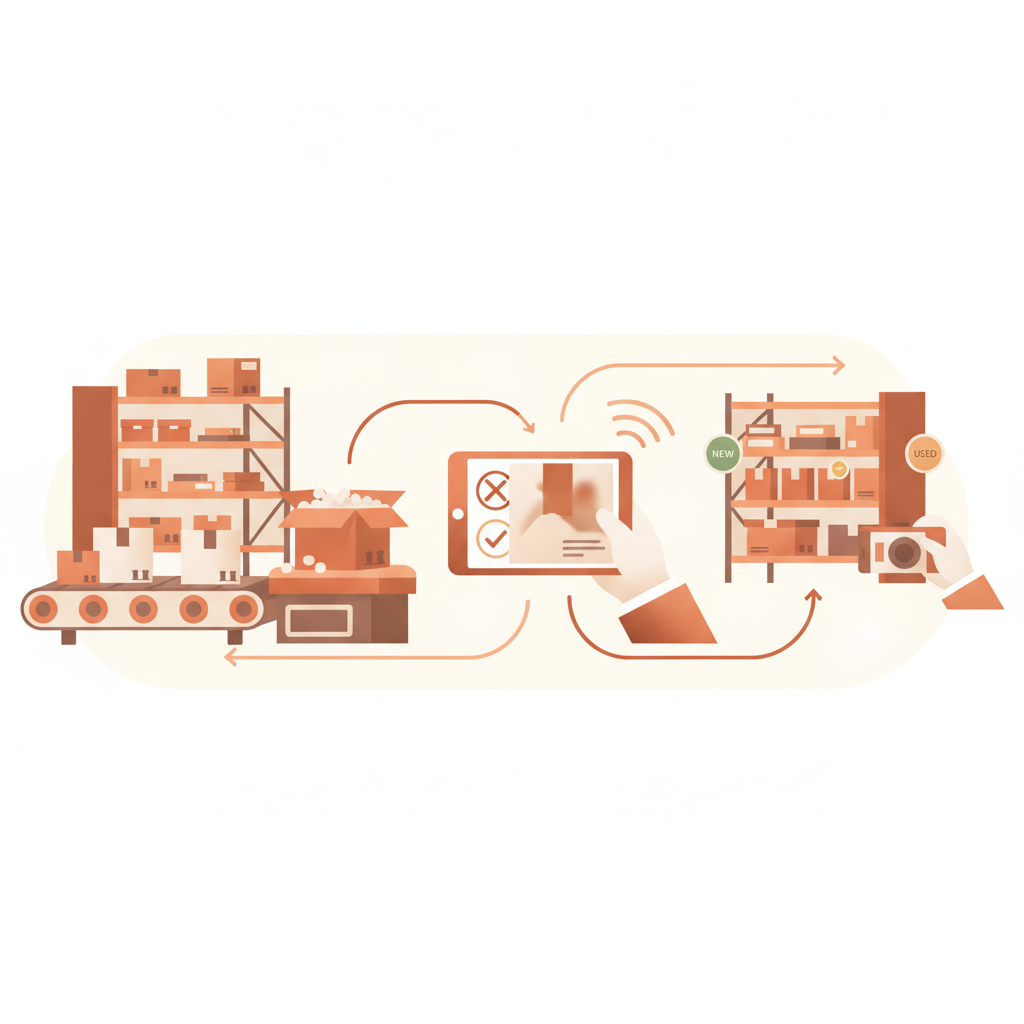
Every return that moves through a node, including the 180K+ returns already processed across the network, now generates a ledger entry at each stage: inbound scan, photo capture, AI grading with its confidence score, any operator override, and the final disposition call (restock, liquidate, donate, destroy). Each entry carries a timestamp, so the ledger reads as an auditable version of the 48 hour median cycle from scan to disposition, rather than an abstract average.
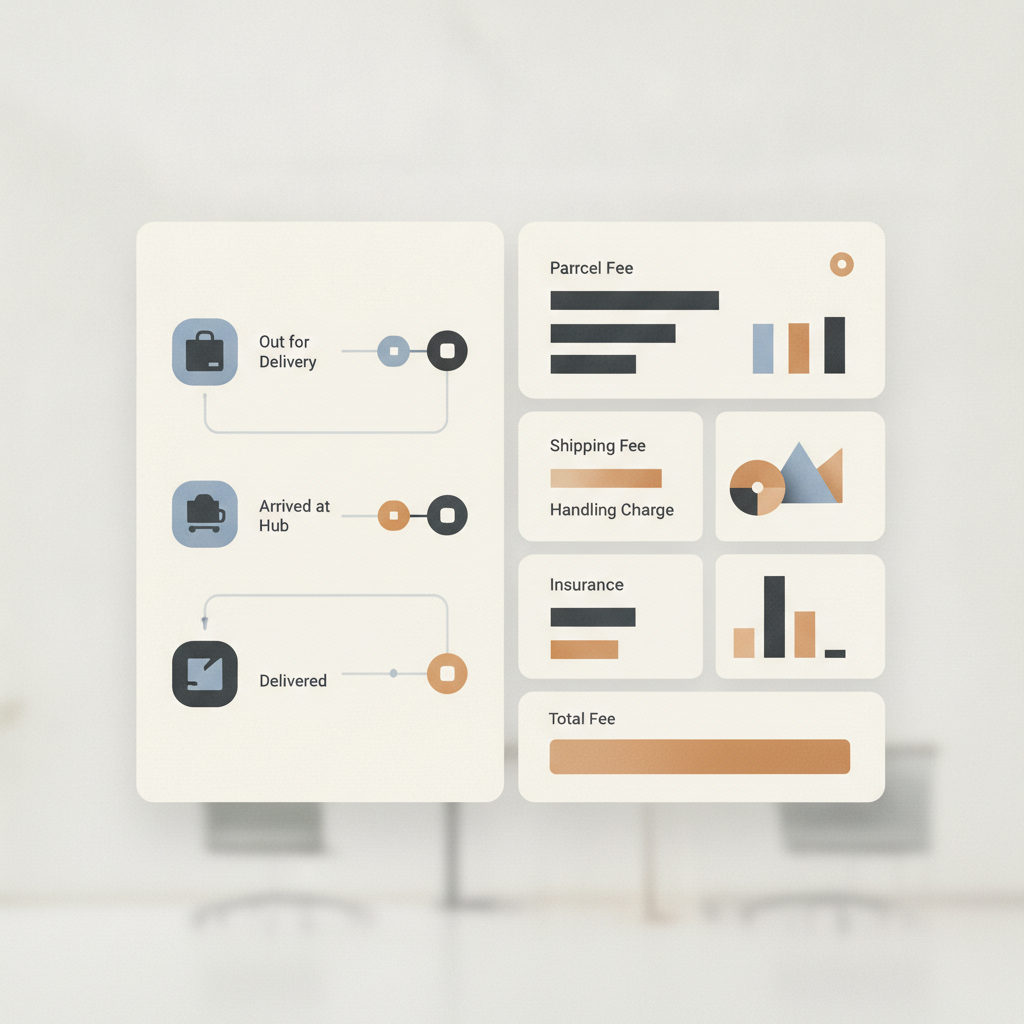
The pricing view sits directly next to it. Instead of a flat monthly statement, each ledger row shows the fee tied to that action: a receiving fee at intake, a grading fee once the AI model and, where applicable, an operator have weighed in, and a disposition fee once the item is routed. Partners reselling the network under their own brand can filter the same ledger by tenant, which keeps the economics visible without exposing one tenant's volume to another.
Why we built it this way
We heard a consistent complaint from ops and finance stakeholders working through partner margin math, a topic covered in our post on pricing a resold returns service: pricing models are easy to build in a spreadsheet and hard to defend when someone asks for proof. A ledger that cites the actual grading confidence score and disposition rule behind each fee removes most of that argument before it starts.
It also matters for anyone treating returns as a real cost center rather than an afterthought, something we argued when we wrote about returns as a P&L line. A ledger that ties cost to cause is what makes that accounting exercise possible in practice instead of in theory.
Before and after: what changed in the dashboard
| Area | Before this release | After this release |
|---|---|---|
| Cost visibility | Monthly invoice summary only | Per-parcel fee tied to each ledger event |
| Cycle time tracking | Aggregate average reported periodically | Live timestamp trail per parcel against the 48 hour median |
| Grading transparency | Grade shown without fee context | Grade, confidence score, and grading fee shown together |
| Partner tenants | Shared summary view | Per-tenant ledger and pricing filter |
| Disputes over billing | Required a support ticket and manual trace | Resolved by opening the ledger entry directly |
How this fits the rest of the platform
The ledger pulls from the same evidence pipeline behind the evidence bundle sample, so nothing here is a separate data source bolted on for billing purposes. Grading still runs on the A/B/C/R scale with a confidence score attached, AI-vs-operator match accuracy still tracks at about 99.6%, and disposition rules still route every parcel with overrides logged. The ledger just makes those existing numbers visible in a format finance can use without asking engineering for a custom export.
For a full picture of current rates and fee structure, the pricing page still holds the baseline. The ledger shows how those rates apply to actual volume moving through NJ-01 and any additional nodes on the network.
What is next
This release is scoped to visibility, not new pricing tiers. The fee logic itself did not change, this just exposes it. Future updates on this track will likely extend the ledger with exportable statements and tighter per-tenant breakdowns, building on the same groundwork covered in our broader product updates hub.
Frequently asked questions
Does the operations ledger change how areturnz prices returns?
No. It does not introduce new fees or change existing rates. It exposes the fee tied to each ledger event (receiving, grading, disposition) so the cost is traceable rather than bundled into a single invoice line.
Can partners see only their own tenant's ledger data?
Yes. The pricing view filters by tenant, so a partner reselling the network under its own brand sees its own fee history without visibility into another tenant's volume or rates.
Is the ledger connected to the evidence bundle?
Yes. Ledger entries reference the same photo evidence, AI grade, confidence score, and disposition decision found in the evidence bundle, so a cost line and its supporting proof live in the same system.
Does this affect the 48 hour cycle time?
No, the ledger reports cycle time, it does not change it. The median remains about 48 hours from inbound scan to disposition, and the ledger simply timestamps each stage for a given parcel so that figure is checkable rather than quoted as an average.
Where can I see current rates before reviewing the ledger?
Start with the pricing page for baseline rates, then use the ledger once returns are flowing to see how those rates apply parcel by parcel.
If you want to see how the operations ledger and pricing view would look against your own return volume, contact areturnz and we can walk through a sample account.
Related reading: Shipped: transactional email delivery via SES
Related reading: Shipped: admin dashboard for node operators
Proof on every return
Photos, an AI condition grade, and a full custody chain, attached to every parcel and available via the API.