Seasonal Staffing Economics: Labor Cost Per Return, Peak vs Off-Peak

Seasonal staffing economics for peak returns is the practice of calculating labor cost per processed return separately for peak and off-peak periods, because headcount, overtime, training time, and error rates all shift when volume spikes. areturnz tracks this at the facility level (NJ-01 in East Hanover) by dividing total receiving and grading labor cost by returns processed in a given window, then comparing that per-unit cost across Q4 surge weeks against a normal April or June baseline. The gap between those two numbers is usually the single biggest line item retailers underestimate when they budget for the holiday returns wave.
Most returns budgets assume labor cost per unit is flat. It is not. A receiving team that costs $1.40 per return in March can cost $2.30 to $3.00 per return in January, even with the same technology stack, because of overtime premiums, temp ramp-up inefficiency, and the quality drag that comes from rushing intake. Understanding that spread, and what narrows it, is the point of this article.
Why labor cost per return is not a fixed number
Labor cost per return is a function of three things: wage rate, throughput per labor hour, and error or rework rate. All three move against you during peak season at the same time, which is why the blended cost per unit does not rise gently, it jumps.
Wage rate pressure
Overtime pushes hourly cost up 1.5x for every hour past the standard shift. Temp labor sourced for a six to ten week surge typically costs more per hour than a trained permanent hire once you account for agency fees, even before productivity differences are factored in.
Throughput per labor hour
New or temporary staff process fewer units per hour than trained operators, especially in the first two weeks. A receiving line that normally handles 40 units per labor hour can drop to 22 to 28 units per hour during the first ramp week of a seasonal hire cohort.
Error and rework rate
Rushed intake during peak weeks produces more misgrades, missing photos, and mis-routed dispositions, all of which require a second touch. Rework is pure labor cost with zero additional units processed, so it quietly inflates the per-unit number even when raw throughput looks fine on a dashboard.
The labor cost per return formula
The core formula is simple on paper: total direct labor cost for the period divided by total returns processed in that period. The complexity is in what you include in "total direct labor cost."
| Cost component | Included in off-peak baseline | Included in peak calculation |
|---|---|---|
| Base wages, trained staff | Yes | Yes |
| Overtime premium | Rare, minimal | Often 15 to 30 percent of hours worked |
| Temp agency fees | Usually none | Can add 20 to 40 percent on top of hourly wage |
| Training and ramp time | Amortized over long tenure | Concentrated in a 6 to 10 week window |
| Rework from misgrades or missing evidence | Low, stable error rate | Elevated, especially weeks 1 to 3 of surge staffing |
| Supervisory and QA overhead | Fixed ratio | Often increased to manage new hires |
Run this calculation monthly, not annually. An annual blended number hides the peak spike entirely and leads teams to under-budget the next Q4. If you have not modeled Q4 volume separately from the rest of the year, peak season returns planning covers how to size that volume forecast before you staff against it.
Peak vs off-peak: a reference comparison
| Metric | Off-peak (typical month) | Peak (Q4 through mid-January) |
|---|---|---|
| Relative return volume | Baseline (1x) | 2.5x to 4x baseline |
| Average labor cost per return | Lowest point in the annual cycle | Can run 1.6x to 2.1x the off-peak figure |
| Overtime share of total hours | Under 5 percent | 15 to 30 percent |
| New/temp staff share of headcount | Near 0 percent | 30 to 50 percent |
| First-pass grading accuracy | Stable, high | Temporarily lower until ramp completes |
| Median cycle time, inbound scan to disposition | Can run faster than network median | Pressure toward or above the roughly 48 hour network median |
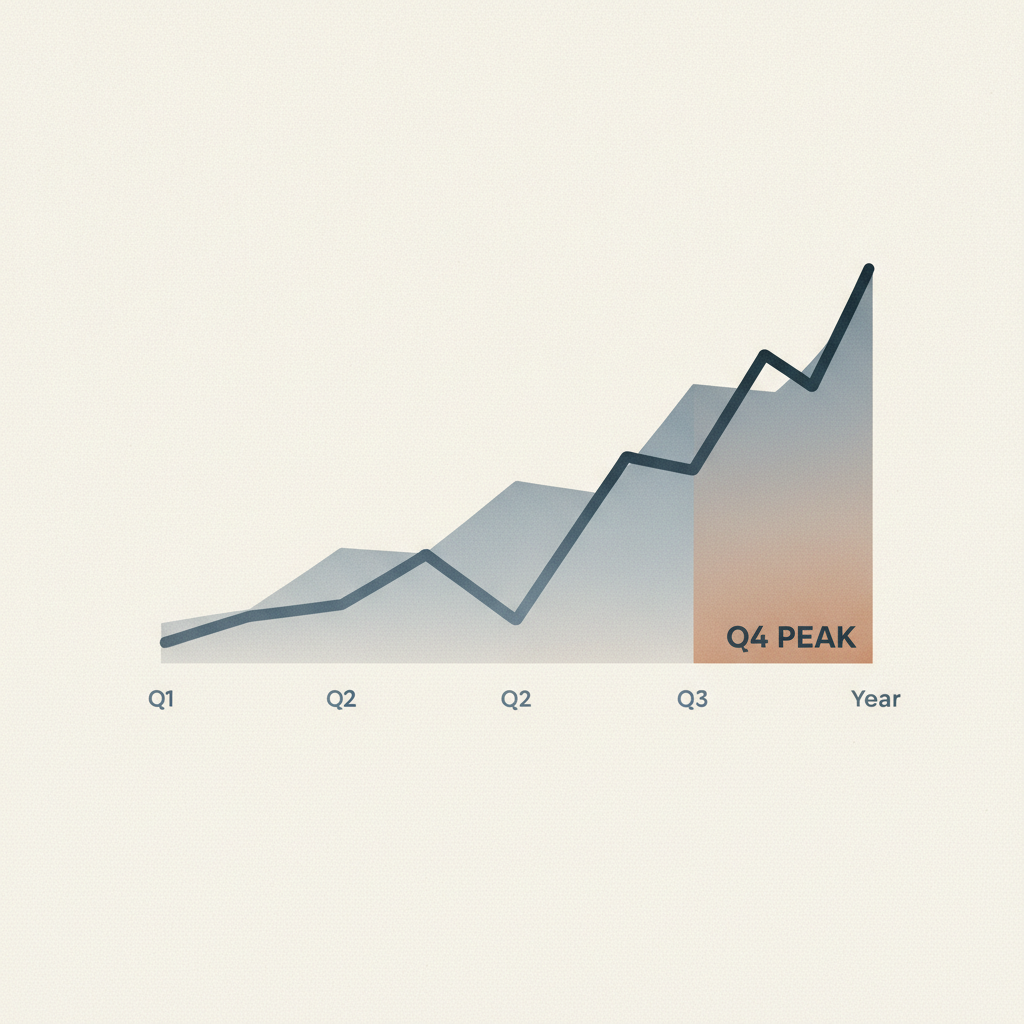
The numbers above are directional, meant to illustrate the shape of the swing rather than to replace your own facility data. The direction is consistent across most operators we talk to: cost per unit rises fastest in the first few weeks of a staffing ramp and compresses back toward baseline once temp staff clear the learning curve, typically by week four or five of a surge.
Where the hidden premium actually comes from
Three sources account for most of the peak premium, and they are not evenly weighted.
Ramp time, not headcount
Adding bodies is the easy part. The expensive part is the two to three week window where new hires produce below-average throughput while still earning full wages. If your surge staffing plan does not budget for a lower-productivity ramp period, your actual peak cost per return will beat your forecast every year, and not in a good way.
Overtime stacking on top of temp costs
Facilities sometimes run both temp labor and overtime on permanent staff simultaneously during the worst weeks, which stacks two premium cost sources at once. That combination is the single fastest way to blow a staffing budget, and it tends to happen when volume forecasting undershoots actual inbound surge.
Rework from rushed grading
When intake speed is prioritized over grading accuracy, the result is more items that need a second look. A consistent AI-vs-operator match rate, something areturnz holds at about 99.6 percent across 180K+ processed returns, matters more during peak weeks precisely because it is the control that keeps rework from scaling with volume. If every misgrade required a human escalation, peak weeks would be where accuracy erodes fastest and labor cost per return climbs highest.
How grading automation changes the staffing math
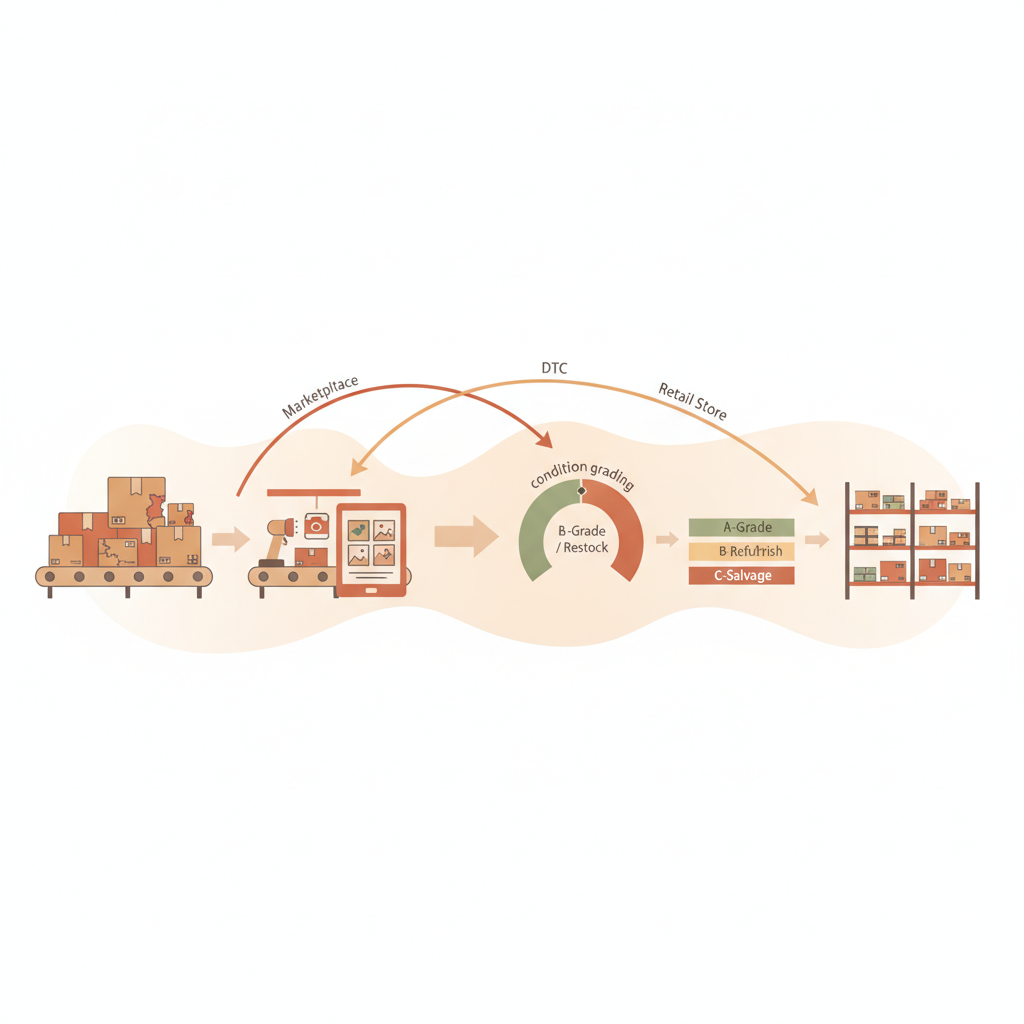
The biggest lever against peak labor inflation is not hiring faster, it is reducing the number of labor-hours required per unit in the first place. AI condition grading on an A, B, C, R scale with a confidence score handles the bulk of routine condition calls, routing only lower-confidence items to a human operator. That means peak-season headcount only needs to scale with the exception rate, not with raw volume, which keeps the cost curve far flatter than most teams expect.
This is also where the evidence layer pays for itself during peak weeks specifically. A disputed return processed without photo documentation at receiving requires a manual investigation days or weeks later, often by a more senior (and more expensive) staff member. A return that ships with an evidence bundle, outer label, opened parcel, item, and defect photos, available via dashboard or signed-JSON API, closes that dispute without pulling anyone off the line. You can see what that documentation actually looks like at the evidence sample page.
Modeling your own peak staffing economics
Four inputs are enough to build a working model: your off-peak labor cost per return, your expected peak volume multiplier, your planned temp labor share, and your current misgrade or rework rate. Run the off-peak number against each lever separately, then combine them, rather than guessing at a single blended peak figure. This is also the point where it is worth comparing what in-house staffing actually costs against outsourcing the surge entirely; the full cost breakdown is in what it really costs to outsource returns processing.
If you operate as a partner or node rather than an in-house team, the staffing question shifts toward capacity planning across facilities rather than a single site, which is covered separately in returns capacity planning for partners. This article focuses on the labor cost accounting itself; that one focuses on scaling node capacity ahead of a volume surge.
For the broader cost framework that seasonal staffing economics sits inside, including restock velocity and liquidation recovery math, see the returns economics guide.
Frequently asked questions
How much higher is labor cost per return during peak season?
It varies by operation, but a 1.6x to 2.1x increase over the off-peak baseline is common once overtime premiums, temp ramp inefficiency, and rework are all accounted for. The exact multiplier depends heavily on how much of the volume surge hits in the first two to three weeks, when new staff are least productive.
Does outsourcing peak returns processing eliminate the staffing cost spike?
It transfers the staffing problem rather than eliminating it, but a network built for surge volume (areturnz processes 180K+ returns with a roughly 48 hour median cycle from inbound scan to disposition) can absorb the ramp inefficiency across many clients instead of one team absorbing it alone for six to ten weeks a year.
What is the single biggest lever for reducing peak labor cost per return?
Reducing the share of units that require a human touch at all. AI grading with a high confidence match rate, around 99.6 percent AI-vs-operator agreement in areturnz's case, keeps exception volume (and therefore headcount need) from scaling linearly with inbound volume.
Should I calculate labor cost per return monthly or annually?
Monthly, at minimum during Q4 through January. An annual blended figure smooths over the peak spike entirely and will cause next year's staffing budget to repeat the same underestimate.
Does rework from misgraded items really move the cost needle?
Yes. Rework is labor spent with no new unit processed, so it inflates cost per return directly. It tends to spike in the first weeks of any seasonal staffing ramp, which is exactly when volume pressure is highest and least forgiving.
If you want to see what a 48 hour peak-season cycle and a 99.6 percent grading match rate would do to your staffing budget, talk to areturnz about your next peak season.
Related reading: Oversized and Bulky Item Returns: The Economics of Large-Item Reverse Logistics
Related reading: Returns Benchmarking by Channel: Marketplace vs DTC vs Retail Store Returns
Proof on every return
Photos, an AI condition grade, and a full custody chain, attached to every parcel and available via the API.