Markdown Decay vs Restock Speed: The Clock That Erodes Margin

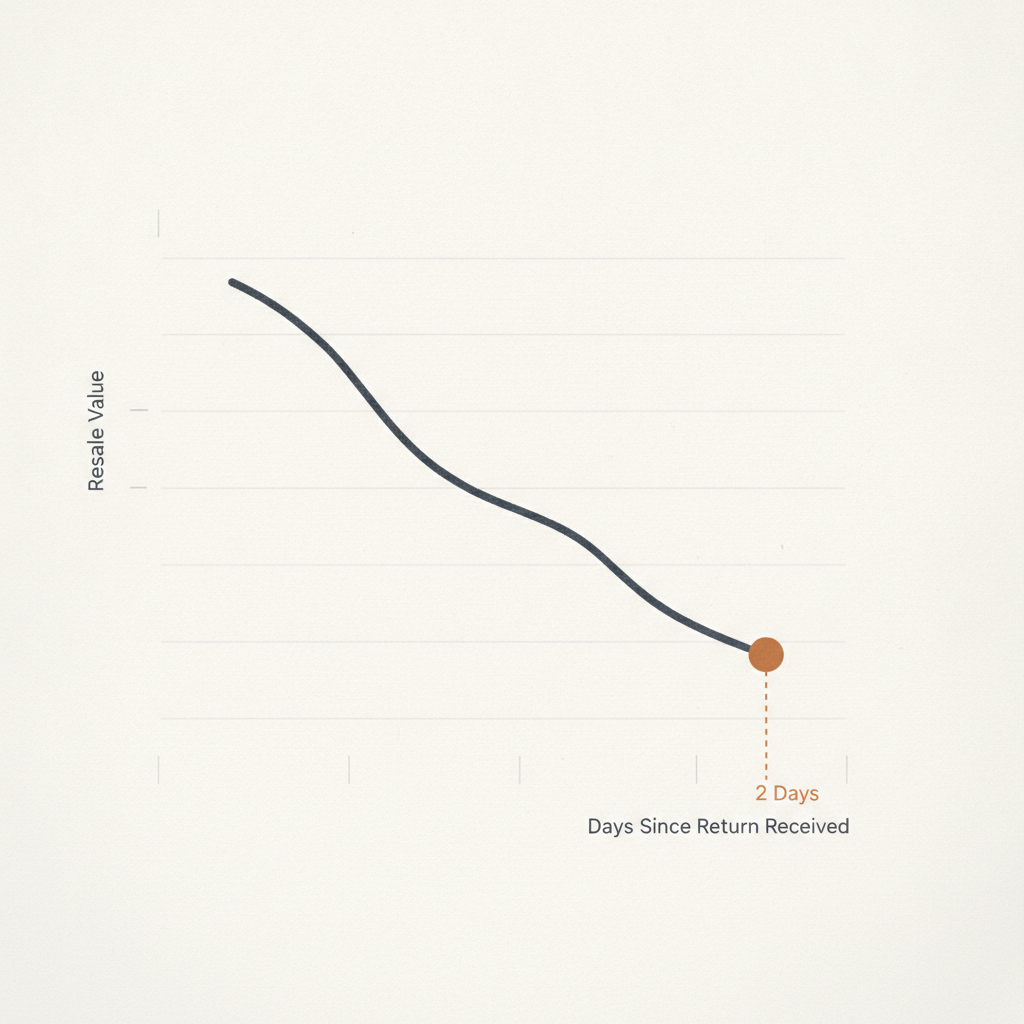
Markdown decay is the steady loss of resale value that happens to a returned item for every day it sits ungraded and unlisted, and restock speed is the only lever that offsets it: the faster a return moves from inbound scan to a disposition decision, the less value it bleeds before it reaches a shelf, an outlet channel, or a liquidation lot. areturnz treats this relationship as a core economics problem, not an operations footnote, which is why its network runs on a median 48 hour cycle from receiving to disposition across 180K+ returns processed.
The clock starts the moment the box lands
Most returns programs measure cycle time loosely, somewhere between \"a few days\" and \"whenever the batch gets processed.\" That vagueness is expensive. A returned item is not neutral inventory sitting in limbo, it is a depreciating asset the second it clears receiving. Apparel loses seasonal relevance. Electronics lose resale value as newer SKUs launch. Beauty products edge closer to expiration windows that make resale or donation harder to justify.
The gap between the refund date and the restock date is where markdown decay lives. Nobody puts it on a P&L line item, but it shows up anyway, as lower recovery rates, as heavier discounting when the item finally gets listed, or as a liquidation lot sold at a fraction of what it would have brought two weeks earlier. Our related piece on the real cost of a return breaks down why the refund itself is rarely the biggest line item.
How fast value actually erodes
Decay rates are not uniform across categories, and treating them as if they were is one of the more common planning mistakes we see in retailer and 3PL operations. The table below shows a directional view of how recoverable value tends to slide as processing time stretches, based on patterns we see across the network.
| Category | Day 2 to 3 (fast cycle) | Day 7 to 10 (typical delay) | Day 21+ (stalled) |
|---|---|---|---|
| Apparel and footwear | 90 to 95% of original value | 70 to 80% | 40 to 55%, often season-locked |
| Consumer electronics | 85 to 92% | 60 to 75% | 35 to 50%, new SKU competition |
| Beauty and personal care | 90 to 95% | 65 to 78% | 30 to 45%, expiration pressure |
| Home goods and durables | 92 to 96% | 80 to 88% | 55 to 65% |
The pattern holds across categories even where the slope differs: the first week matters most. A grading and disposition decision made inside a 48 hour window captures most of the recoverable value. Wait two or three weeks and the same item is competing with newer inventory, different demand seasons, or a shrinking donation and liquidation window.
Where most programs lose the race against the clock
Delay rarely comes from one dramatic failure. It comes from small stalls that compound: parcels waiting in a receiving queue, condition assessments that require a human to physically re-inspect an item because the first grade was uncertain, disposition rules that were written once and never revisited, and disputes over condition that hold inventory hostage while someone argues about what \"like new\" actually means.
Each of those stalls is solvable, but only if the grading step itself is fast and trustworthy. This is where AI condition grading changes the math. When every parcel is photographed at receiving (outer label, opened parcel, item, and any defect) and graded on an A/B/C/R scale with a confidence score, the decision to restock, liquidate, donate, or destroy can be made without waiting on a human to eyeball a stack of items days later. Our explainer on how AI condition grading actually works covers the mechanics in more detail.
Why confidence scores matter more than raw accuracy
A grading system that is accurate on average but slow to flag its own uncertainty still creates bottlenecks, because someone has to manually review every borderline case. areturnz runs at about 99.6% AI-vs-operator match accuracy, and the confidence score attached to each grade tells receiving staff exactly which items need a second look and which can move straight to disposition. That distinction is what keeps the 48 hour median cycle real instead of aspirational.
Compressing the clock without cutting corners
Speed only helps if it does not sacrifice the evidence trail that protects against disputes and buyer trust issues later. Every return in the areturnz network ships with a full evidence bundle, available in the dashboard or via a signed-JSON API with webhooks, so a fast disposition decision is never a black box. Operator overrides are logged against the AI grade, which means a facility can move quickly at the NJ-01 site in East Hanover, New Jersey without losing the audit trail that a brand or platform partner would need if a grading decision were ever challenged. You can see what that evidence actually looks like at the evidence sample page.
The practical effect is that disposition rules can be tuned aggressively for speed, because the confidence scoring and photo evidence absorb the risk that would otherwise require a slower, more conservative process. Our piece on disposition rules turning grades into decisions goes deeper on how that routing logic is built.
Measuring your own decay-adjusted cost of delay
If you want a rough gut check on how much markdown decay is costing your program, start with three numbers: your current median cycle time from inbound scan to disposition, your category mix, and an estimate of value retained at that cycle time using a table like the one above. Multiply the gap between your current recovery rate and what a 48 hour cycle would recover, across your return volume, and you get a number that usually surprises people the first time they run it.
This is the same logic behind restock velocity as a metric, which we cover in depth in restock velocity: the metric that pays for your returns program, the piece this article extends. Markdown decay is the cost side of that equation, restock speed is the recovery side, and the two only balance when grading and disposition happen fast enough to matter.
For teams evaluating whether a network built around this exact tradeoff fits their volume, the partner use cases page and pricing overview are good starting points.
Frequently asked questions
What is markdown decay in returns processing?
Markdown decay is the loss in resale value a returned item experiences the longer it sits ungraded and unlisted after being returned. It is driven by seasonal relevance, new product competition, expiration windows, and general demand drift, and it compounds daily until a disposition decision is made.
How does restock speed offset markdown decay?
Restock speed determines how much of an item's original value is still recoverable when it reaches its next channel, whether that is resale, liquidation, or donation. A faster cycle from inbound scan to disposition, like the 48 hour median at areturnz, captures more of that value before decay sets in.
Does markdown decay affect every product category the same way?
No. Apparel and beauty products tend to decay faster due to seasonality and expiration pressure, while home goods and durables hold value longer. Category-specific decay curves should inform how aggressively a program prioritizes speed.
How does AI grading reduce the delay that causes decay?
AI condition grading assigns an A/B/C/R grade with a confidence score at receiving, which lets high-confidence items move straight to disposition without waiting for manual review. Only low-confidence or flagged items need a human second look, which keeps the overall cycle fast without sacrificing accuracy.
Can a decay-adjusted view change how a returns program is priced or budgeted?
Yes. Once a team quantifies the value lost per day of delay, it becomes easier to justify investing in faster grading and disposition infrastructure, since the cost of slow cycles is usually larger than the cost of the processing itself.
If you want to see how a 48 hour cycle and evidence-backed grading would change your own decay math, contact areturnz to walk through your category mix and current cycle times.
Related reading: The real cost of a chargeback for returns-heavy sellers
Related reading: Liquidation recovery rates: what you actually get back


