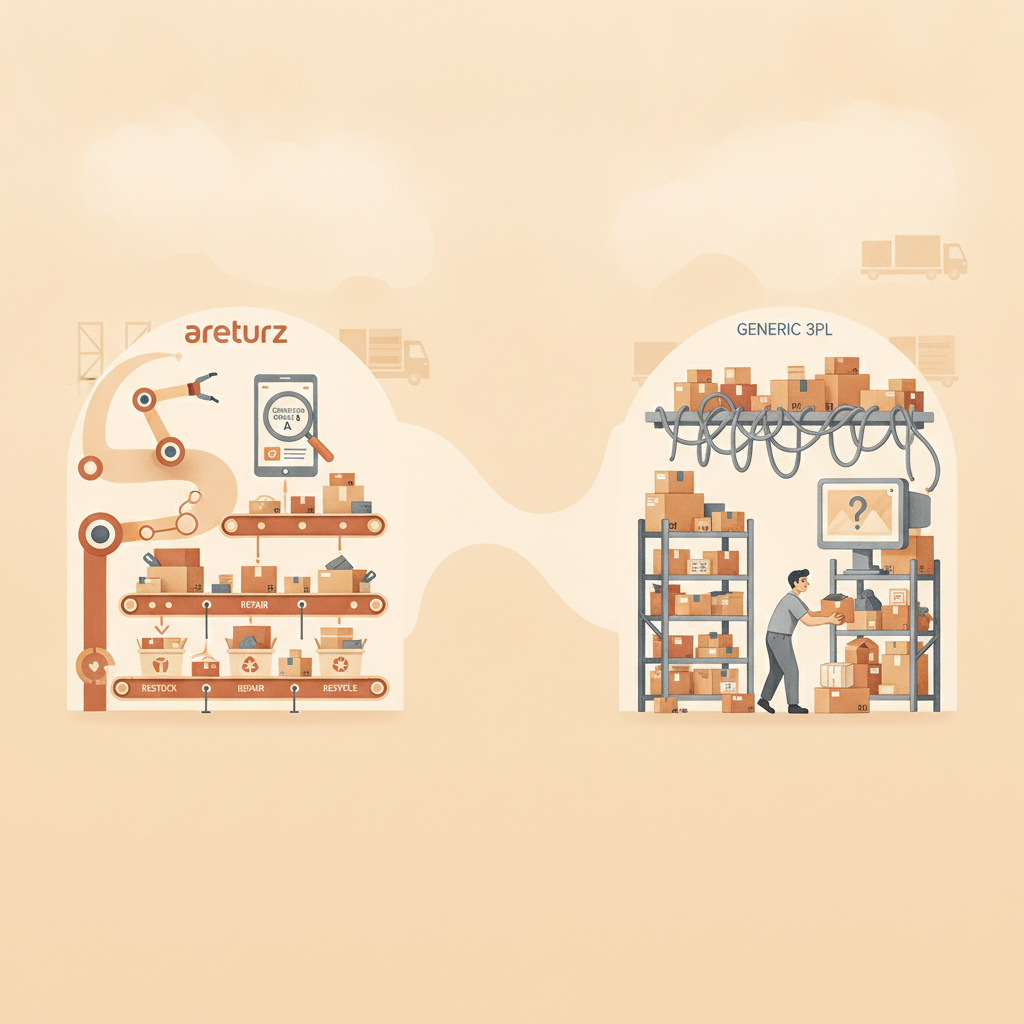
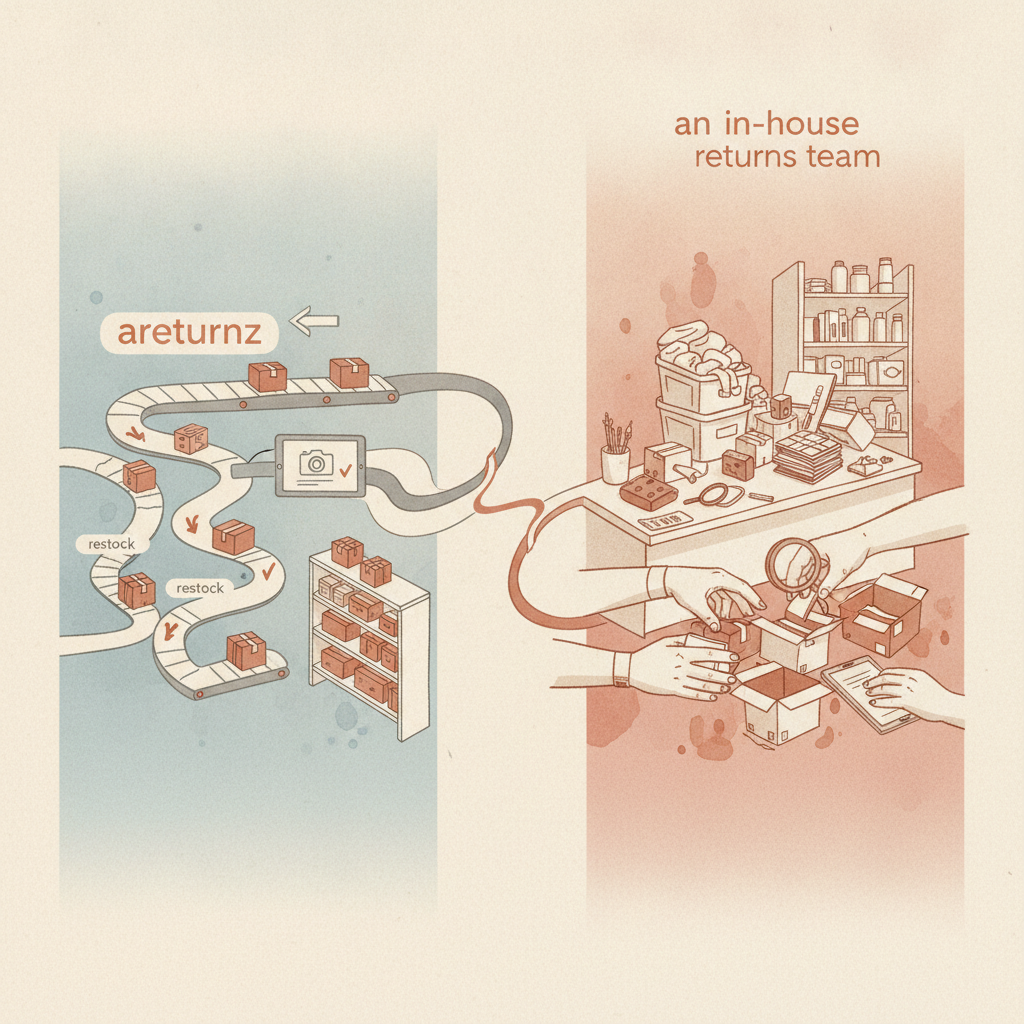
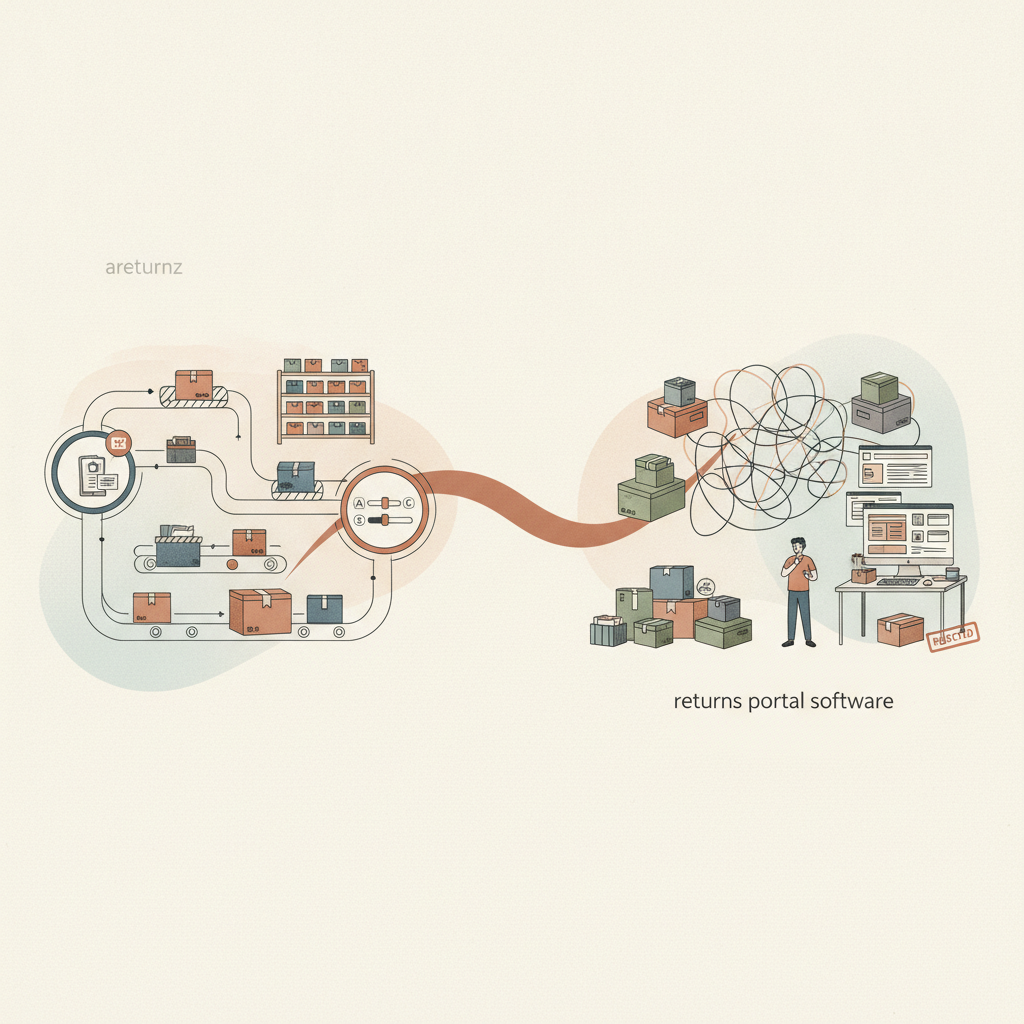
Cost of Returns Processing: The Complete Returns Economics Guide
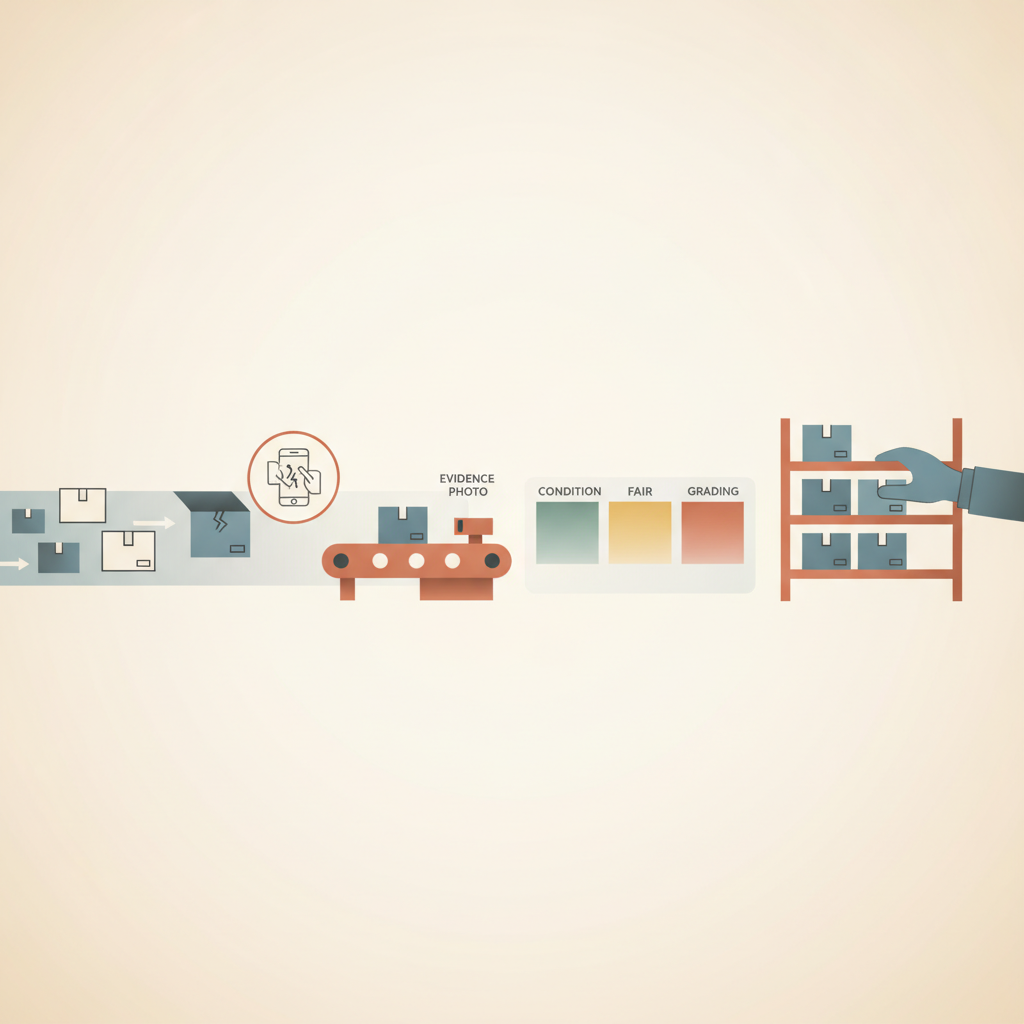
The cost of returns processing is the sum of every dollar it takes to receive, inspect, grade, and route a returned item until it lands somewhere useful, back on a shelf, in a liquidation lot, at a donation partner, or in a destruction bin, plus the carrying cost and markdown decay that accumulate while that decision sits unresolved. areturnz exists to compress that stack: every parcel gets photographed at intake, graded A/B/C/R by AI with a confidence score, and pushed to disposition in a median of 48 hours across a network that has now processed more than 180,000 returns with 99.6% AI-versus-operator match accuracy.
Most retailers still price a return at the refund amount plus a rough shipping estimate. That number is wrong, and it is wrong in a way that hides the biggest levers available to fix it. This page works through the real cost stack, points to the deep-dive articles on each piece, and shows where an owned, evidence-backed network changes the unit economics instead of just moving the paperwork around.
What actually drives the cost of processing a return
A return does not cost one number. It costs a stack of smaller numbers that most finance teams never separate, which is exactly why returns quietly erode margin without ever showing up as a single line item worth fixing.
| Cost component | What drives it | Lever that reduces it |
|---|---|---|
| Receiving and labor | Manual unboxing, inconsistent inspection, re-work on mismatched SKUs | Scan-first receiving and standardized photo capture at intake |
| Inspection and grading | Subjective condition calls, disagreement between operators | AI grading against A/B/C/R with a confidence score on every item |
| Carrying cost while undecided | Days or weeks sitting in limbo before a disposition decision | Cycle time compression, ideally under a 48 hour median |
| Markdown decay | Every extra day in transit or storage before restock | Faster restock velocity, addressed directly in markdown decay vs restock speed |
| Liquidation loss | Wrong channel for the grade, or grading errors that misroute good stock | Grade-matched routing, see liquidation recovery rates |
| Chargebacks and disputes | No proof of condition or delivery to counter a claim | Photo evidence bundles, see the real cost of a chargeback |
| Cross-border friction | Duty, customs holds, and reverse logistics across the EU border | Regional receiving math, see cross-border returns math |
| Reserve mispricing | Budgeting for returns that have not arrived yet | Modeled reserve accounting, see returns reserve accounting |
Add those rows up for a mid-size apparel or electronics program and the true cost of returns processing usually lands two to four times higher than a refund-plus-shipping estimate. That gap is the opportunity.
Why cycle time is the hidden lever
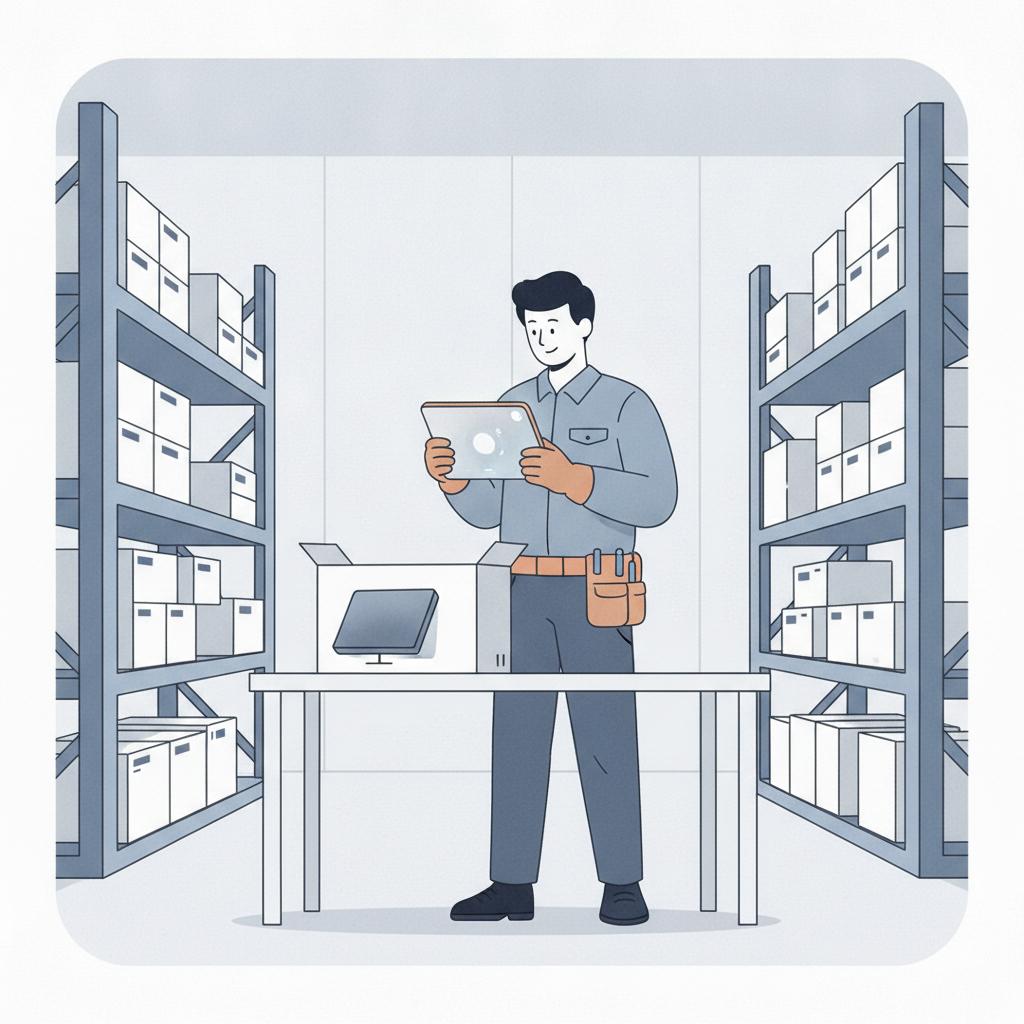
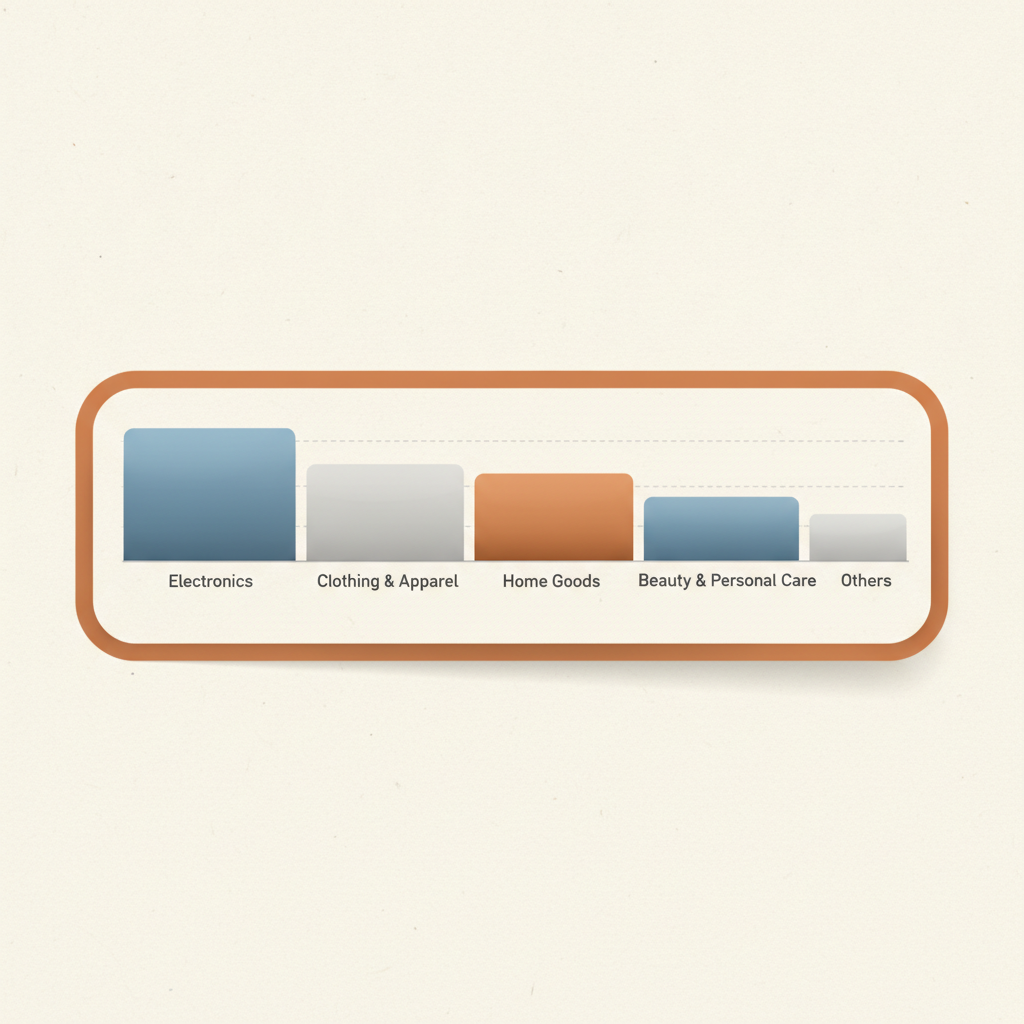
Every day a return sits between inbound scan and disposition is a day of carrying cost and, for anything with a shelf life or a season, a day of markdown decay. A shirt that could have resold at 90% of ticket price in week one is often worth 60% by week four. Electronics lose relevance to the next product cycle. Beauty products lose shelf life outright.
This is why cycle time matters more than most cost models admit. areturnz runs a 48 hour median from inbound scan to disposition, which is the difference between catching a sell-through window and missing it. The mechanics of that math are broken down in the real cost of a return and in restock velocity: the metric that pays for your returns program, which treats speed itself as a P&L input rather than an operations vanity metric.
Where the accounting has to catch up
Faster cycles also change how returns should be budgeted, not just how fast they move. Returns as a P&L line walks through why returns deserve their own line instead of getting buried in COGS or shipping, and returns reserve accounting covers how to size a reserve for volume that has not hit the dock yet.
Where the money actually leaks after grading
Grading is a checkpoint, not the finish line. What happens after a return is graded A, B, C, or R determines whether the value survives. A grade-B item routed to the wrong liquidation channel can recover 20 to 30 cents less on the dollar than the same item routed correctly, which is why disposition rules matter as much as the grade itself. Liquidation recovery rates lays out what different grades and channels actually pay, and disposition rules: turning grades into decisions covers how routing logic gets built so grade and channel stay matched.
Disputes, fraud, and cross-border add their own tax
Cost does not stop at disposition. Chargebacks, item-not-as-described claims, and marketplace fraud all attach a second cost to a return that already cost money once. The real cost of a chargeback quantifies what an unresolved dispute costs beyond the refund itself, and cross-border programs carry their own version of this tax, covered in cross-border returns math, where duty and customs handling change the unit economics at the EU border specifically.
Peak season multiplies every one of these costs
None of this holds steady across the year. Q4 volume spikes strain receiving capacity, slow cycle times, and increase the odds of misgrading under pressure, and the returns that come back in January behave differently than the returns that come back in July. Peak season returns planning covers budgeting for Q4 volume before it hits, and the January returns spike covers what changes in grading mix, restock velocity, and disposition volume right after the holidays end.
How areturnz changes the unit economics
The reason to treat returns processing as an owned network problem instead of a portal-and-label problem comes down to three numbers. A 48 hour median cycle from inbound scan to disposition keeps carrying cost and markdown decay contained. A 99.6% AI-versus-operator match accuracy means grading decisions hold up without a slow manual review queue on most volume. And a network that has processed 180,000-plus returns through facility NJ-01 in East Hanover, New Jersey has the throughput data to keep tuning disposition rules instead of guessing at them.
Every one of those returns ships with a full evidence bundle, photos of the outer label, the opened parcel, the item, and any defect, available in the dashboard or through a signed-JSON API with webhooks. That evidence is what makes disputes closeable and liquidation channels trustworthy, which is the subject of the sibling pillar on returns evidence and dispute proof. You can see what a real evidence bundle looks like at the evidence sample page, and see how the network prices out at pricing.
Where partners fit into the cost model
Brands and 3PLs that resell returns processing under their own name inherit these same unit economics without building the receiving, grading, or evidence infrastructure themselves. That model is covered in the partner use case overview and in the white-label returns platform partner playbook.
Where to go next in this library
| If you are trying to | Read this |
|---|---|
| Prove returns cost more than the refund | The real cost of a return |
| Justify faster restock as a margin lever | Restock velocity metric |
| Model markdown decay against cycle time | Markdown decay vs restock speed |
| Give returns their own P&L line | Returns as a P&L line |
| Budget a reserve for returns not yet received | Returns reserve accounting |
| Know what liquidation actually pays out | Liquidation recovery rates |
| Quantify chargeback and dispute cost | The real cost of a chargeback |
| Handle EU and cross-border return math | Cross-border returns math |
| Plan for Q4 volume before it hits | Peak season returns planning |
| Understand what changes right after the holidays | The January returns spike |
Frequently asked questions
What is the average cost of processing a return?
There is no single industry-wide number because it depends on category, cycle time, and disposition mix, but most programs underestimate it by two to four times when they only count refund and shipping. The full stack includes labor, grading, carrying cost, markdown decay, liquidation loss, and dispute risk, all covered above.
How does cycle time affect the cost of returns processing?
Every extra day between inbound scan and disposition adds carrying cost and, for anything time-sensitive, markdown decay. areturnz targets a 48 hour median cycle specifically to keep that decay window short and preserve resale value.
Does AI grading actually lower the cost of returns processing?
It lowers cost when it is accurate enough to reduce manual review without increasing misrouted grades. areturnz runs a 99.6% AI-versus-operator match accuracy across A/B/C/R grading with a confidence score on every item, which is detailed in the AI and grading pillar.
What is the difference between returns processing cost and returns as a P&L line?
Processing cost is the operational spend to move a single return through the network. Treating returns as a P&L line means budgeting for that cost, the reserve for future volume, and the recovery rate together as one ongoing financial category rather than a one-off expense.
Why does evidence matter for the cost of returns processing?
Without photo evidence and a chain of custody, disputes and chargebacks stay open longer and cost more to resolve, and resold open-box or liquidated inventory carries more buyer risk. Evidence is what turns a disposition decision into a defensible one.
Ready to see what your actual cost stack looks like? Talk to areturnz and get a walkthrough of the evidence bundle, the grading confidence scores, and the disposition rules running against your return volume today.
Prova em cada devolução
Fotos, uma avaliação de condição por IA e uma cadeia de custódia completa, anexadas a cada encomenda e disponíveis via API.